March Madness, Monte Carlo Style!
I’m teaching Thermal Physics this term, so obviously I rearranged the syllabus so that we could all run Monte Carlo simulations for March Madness!
Quick summary for the class is at the end
The basics
We started off writing an energy function and figuring out how to play a simple 8-team bracket (side-note: IPython notebooks were great for this purpose! We were able to record our class sessions and post them online, along with a “Scientific Cookbook”). This version of Thermal Physics doesn’t have a programming prerequisite, so the coding parts of the assignments stopped with running and analyzing 8-team brackets.
We then spent a chunk of class time comparing our simulations with the 2-state paramagnets we’d seen in Schroeder’s text (we covered section 8.2 a bit out of sequence). In that context, it was clear what a Monte Carlo move was. We convinced ourselves that we could do something similar in bracket space, but that we couldn’t just flip a single game (we also had to consider flipping the games that depended on that game). The coding for that part was definitely beyond the scope of this class, but I hacked up an ugly version for us to use.
Warnings to the programmers in audience: this code is very much not pretty and very much not optimized. In particular, the Bracket code is really slow, to the point where it takes a noticeable amount of time to run 10000 brackets. The main goals were (1) get something written (2) make it easy for the students to modify the parts they need to modify. Please feel free to send comments! If I get more than 1, I’ll consider stuffing things on github, etc.
So, to run things, download all of the Python files Brackets.py JeffSagarin.py KenPomeroy.py MonteCarloBrackets.py RankingsAndStrength.py Stats.py Visualization.py decorators.py from This directory on my website.
EDIT: See the comments. Daniel Smith has made some improvements and started a github repo, which I’ve forked.
wget http://mglerner.com/MarchMadness/Brackets.py
wget http://mglerner.com/MarchMadness/JeffSagarin.py
wget http://mglerner.com/MarchMadness/KenPomeroy.py
wget http://mglerner.com/MarchMadness/MonteCarloBrackets.py
wget http://mglerner.com/MarchMadness/RankingsAndStrength.py
wget http://mglerner.com/MarchMadness/Stats.py
wget http://mglerner.com/MarchMadness/Visualization.py
wget http://mglerner.com/MarchMadness/decorators.py
You then need to have matplotlib installed. I highly recommend the Enthought Python Distribution.
From the IPython prompt (making sure you’re in the directory that has all of the downloaded files), you can look at a single bracket like this:
run MonteCarloBrackets.py
teams = RAS.teams['south']
b = Bracket(teams=teams,T=0.5)
print b
which will print out something like
Kansas (1)
Western Kentucky (16)     Kan (1)
North Carolina (8)
Villanova (9)             Vil (9)  Vil (9)
Virginia Commonwealth (5)
Akron (12)                Vir (5)
Michigan (4)
South Dakota St. (13)     Mic (4)  Vir (5)  Vil (9)
UCLA (6)                  UCL (6)  Flo (3)  Geo (2)  Geo (2)
Minnesota (11)
Florida (3)               Flo (3)
Northwestern St. (14)
San Diego St. (7)         Okl (10) Geo (2)
Oklahoma (10)
Georgetown (2)            Geo (2)
Florida Gulf Coast (15)
Total bracket energy: -17.7885496023
By default, the energy is calculated by the function
import RankingsAndStrength as RAS
strength = RAS.kenpom['Pyth'] # Use Ken Pomeroy’s “Pyth”
def energy_game(winner,loser):
    result = -(strength[winner]/strength[loser])
    return result
and you can define your own energy function fairly easily, including the coin-flipping favorite
def energy_game(winner,loser):
    result = random()
    return result
While we’re talking about rankings, one quick note: one of the class-favorite energy functions was based on the team rankings. The official tournament rankings are only defined in groups of 16 (i.e the South, the East, the Midwest and the West). So, in order to compare them across regions, I add a bit of randomness in the middle of RankingsAndStrength.py:
for region in teams:
    for (team,rank) in zip(teams[region],_rankings):
        regional_rankings[team] = rank + random()/10
So, if you just want one bracket based on your energy function, you can run the above code, but with teams=”all”. You are now equipped to beat all of your friends in your bracket pool!
But wait! There’s more!
We went to the trouble of figuring out how to make moves in bracket space. So, we have a simulate(ntrials,region,T) function that starts at a random (but valid) point in bracket space and makes ntrials moves, using the Metropolis algorithm with your energy function and temperature T to accept or reject moves properly. There are a few more details including plotting the results, but here’s the important part of simulate:
def simulate(ntrials,region,T):
    teams = RAS.teams[region]
    b = Bracket(teams,T)
    ng = sum(b.games_in_rounds) # total number of games
    # Let’s collect some statistics
    brackets = []
    for trial in xrange(ntrials):
        g = choice(range(ng)) # choose a random game to swap
        #print “attempted swap for game”,g#,”in round”,round[g]
        newbracket = deepcopy(b)
        newbracket.swap(g)
        ediff = newbracket.energy() – b.energy()
        if ediff <= 0:
            b = newbracket
        else:
            if random() < exp(-ediff/T):
                b = newbracket
        brackets.append(b)
We keep track of all of the each bracket in the brackets list, and then use it to print out some statistics. So, what does that look like?
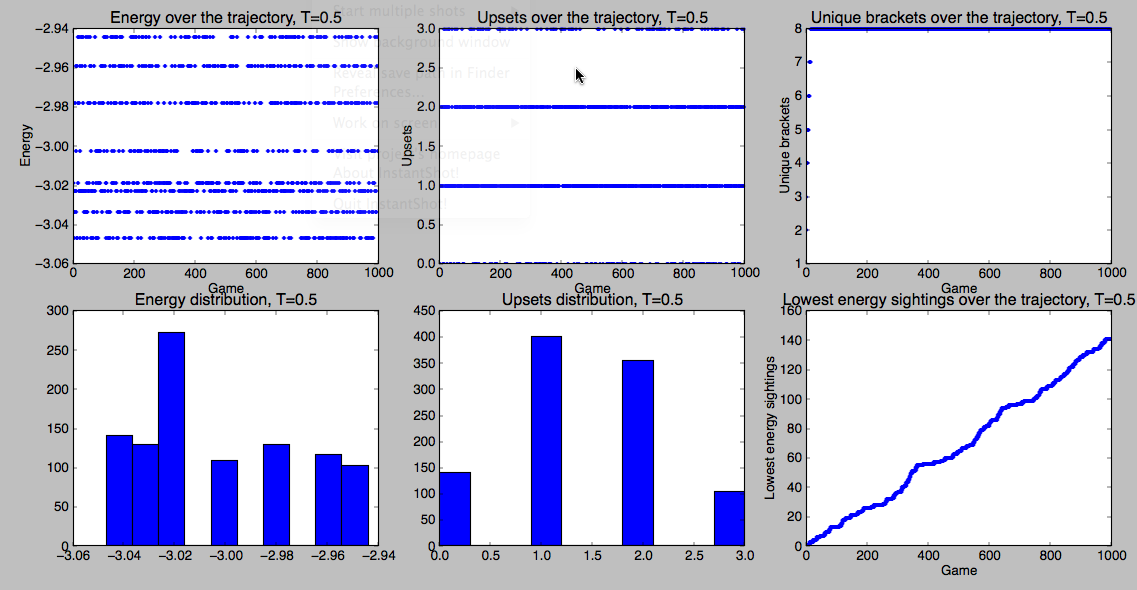
simulate(100,’south’,0.5)
which plots the following image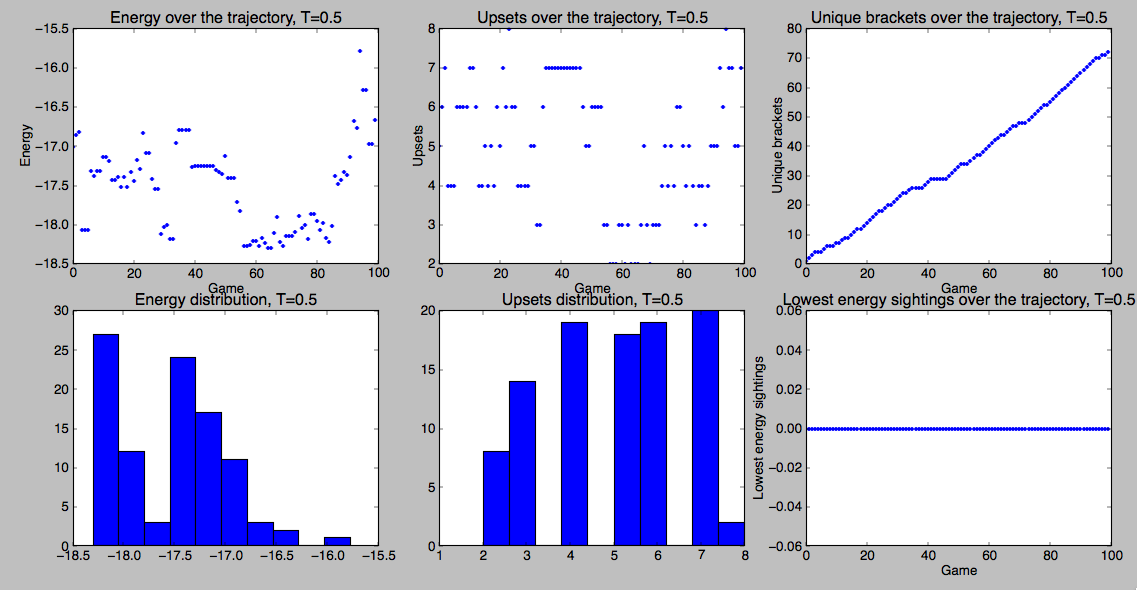
Here, I’ve plotted at least a few useful things. Looking on the left side you can verify whether or not we’re seeing a Boltzmann distribution. You know that bracket space is really big (quiz: how big?). So, one way to assess our sampling is to keep track of the number of unique brackets we’ve seen. That’s on the top right. If we’ve fully sampled bracket space, you’d expect that to approach a horizontal asymptote. You can actually see that behavior if you run a small bracket with lots of trials (pro tip: one of the things I haven’t mentioned yet is that you can specify a list of teams like ["Kansas","Kentucky","Indiana","Duke"] as the second argument to simulate, instead of a region).
simulate also prints out both the lowest energy bracket possible with your energy function and the most probable bracket according to your Monte Carlo sampling (the one below showed up 6 times)
Most common bracket (6)
Kansas (1)
Western Kentucky (16)     Kan (1)
North Carolina (8)
Villanova (9)             Vil (9)  Vil (9)
Virginia Commonwealth (5)
Akron (12)                Vir (5)
Michigan (4)
South Dakota St. (13)     Mic (4)  Mic (4)  Vil (9)
UCLA (6)                  UCL (6)  Flo (3)  Flo (3)  Flo (3)
Minnesota (11)
Florida (3)               Flo (3)
Northwestern St. (14)
San Diego St. (7)         Okl (10) Flo (15)
Oklahoma (10)
Georgetown (2)            Flo (15)
Florida Gulf Coast (15)
Total bracket energy: -17.2487840302

Lowest energy bracket
Kansas (1)
Western Kentucky (16)     Kan (1)
North Carolina (8)
Villanova (9)             Nor (8)  Kan (1)
Virginia Commonwealth (5)
Akron (12)                Vir (5)
Michigan (4)
South Dakota St. (13)     Mic (4)  Mic (4)  Kan (1)
UCLA (6)                  Min (11) Flo (3)  Flo (3)  Flo (3)
Minnesota (11)
Florida (3)               Flo (3)
Northwestern St. (14)
San Diego St. (7)         San (7)  Geo (2)
Oklahoma (10)
Georgetown (2)            Geo (2)
Florida Gulf Coast (15)
Total bracket energy: -18.3666003991
You can, of course, run more simulations
simulate(10000,’south’,0.5)
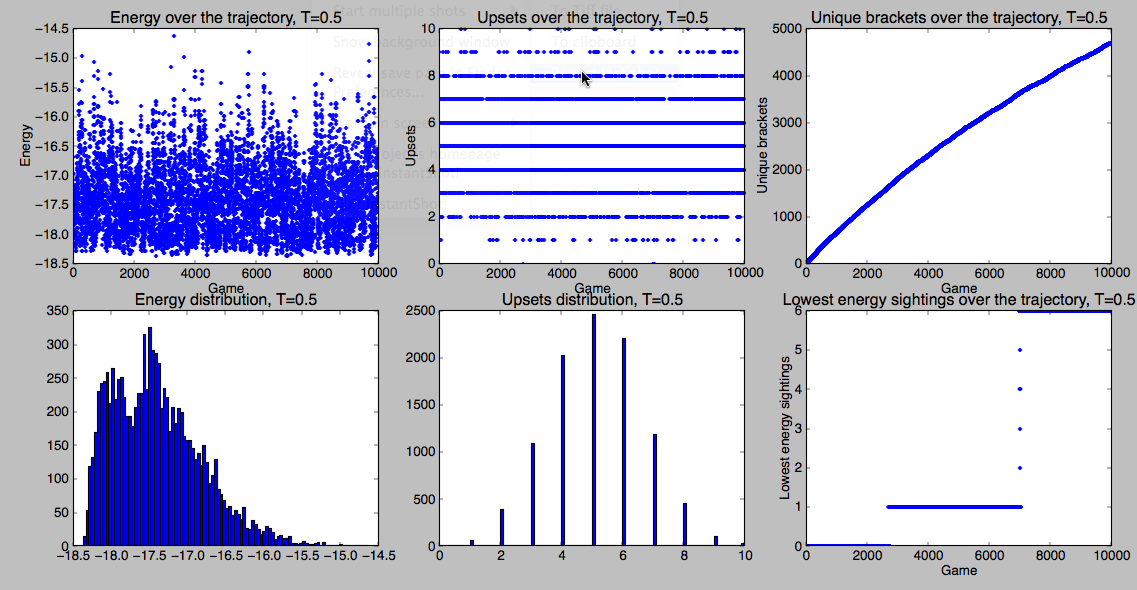
Most common bracket (16)
Kansas (1)
Western Kentucky (16)     Kan (1)
North Carolina (8)
Villanova (9)             Nor (8)  Nor (8)
Virginia Commonwealth (5)
Akron (12)                Vir (5)
Michigan (4)
South Dakota St. (13)     Sou (13) Vir (5)  Nor (8)
UCLA (6)                  Min (11) Flo (3)  Flo (3)  Flo (3)
Minnesota (11)
Florida (3)               Flo (3)
Northwestern St. (14)
San Diego St. (7)         Okl (10) Okl (10)
Oklahoma (10)
Georgetown (2)            Geo (2)
Florida Gulf Coast (15)
Total bracket energy: -17.716285007

Lowest energy bracket
Kansas (1)
Western Kentucky (16)     Kan (1)
North Carolina (8)
Villanova (9)             Nor (8)  Kan (1)
Virginia Commonwealth (5)
Akron (12)                Vir (5)
Michigan (4)
South Dakota St. (13)     Mic (4)  Mic (4)  Kan (1)
UCLA (6)                  Min (11) Flo (3)  Flo (3)  Flo (3)
Minnesota (11)
Florida (3)               Flo (3)
Northwestern St. (14)
San Diego St. (7)         San (7)  Geo (2)
Oklahoma (10)
Georgetown (2)            Geo (2)
Florida Gulf Coast (15)
Total bracket energy: -18.3666003991
So, now maybe we’re ready to run a full bracket. I can think of at least two reasonable ways to do that. The first is just to run it:
simulate(10000,’all’,0.5)
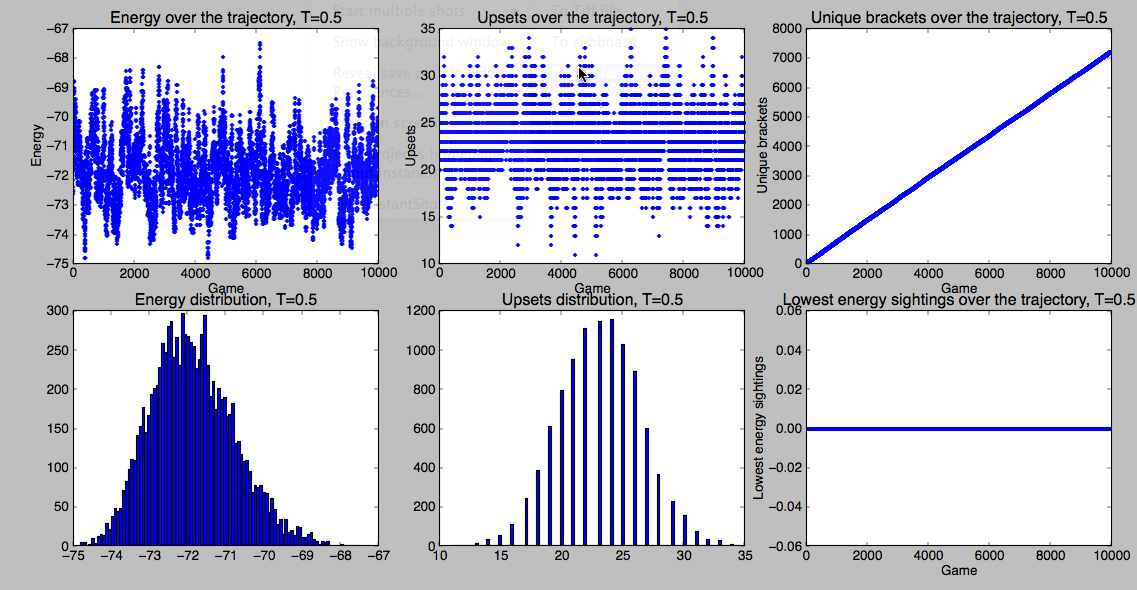
On the other hand, as you can see, that’s only sampling a tiny bit of bracket space. When I run it, the most common bracket is only seen 8 times out of the 10000, for instance.
Another strategy would be to simulate each of the regions a bunch of time (you can sit around and wait for 100,000 times on your own machine, etc.). Then you can run your own Final Four using a secret feature: you can specify a list of teams instead of a region:
simulate(1000,['Louisville','Gonzaga','Kansas','Indiana'],0.5)
Most common bracket (148)
Louisville (1)
Gonzaga (1)               Lou (1)
Kansas (1)                Kan (1)  Lou (1)
Indiana (1)
Total bracket energy: -3.02255561688

Lowest energy bracket
Louisville (1)
Gonzaga (1)               Lou (1)
Kansas (1)                Ind (1)  Lou (1)
Indiana (1)
Total bracket energy: -3.04693046285
You’d then piece together a complete bracket from your results (don’t forget to keep track of the regional brackets!).
These are, conveniently, already coded up for you via
runbracket1(ntrials=10000,T=1.0)
and
runbracket2(ntrials1=10000,ntrials2=1000,T=1.0)
What if you just want to place bets?
We learned something from Nate Silver’s political simulations. Most bets involve things like the probability that team X makes the final four. If you want to do that, you could do the same thing Silver does: run a ton of independent simulations, keep the results in a list, and then calculate statistics over that list. You can feel free to do so for a significant chunk of extra credit.
QUICK SUMMARY FOR THE CLASS:
- Download all of the python files from the website
- Change the energy function in MonteCarloBrackets.py to do what you want. For instance, you can use any combination of the strengths from Ken Pomeroy by using RAS.kenpom['Pyth'], etc. I’ve also added Jeff Sagarin’s ratings (RAS.sagarin['Rating']). Remember that you should all have a “silly” function (e.g. one of you has a dictionary that keeps track of how awesome a team’s mascott is). You can combine silly with non-silly as well. You get up to 10 brackets total.
- Generate brackets with either of the methods mentioned above (running with ‘all’ or running the regions individually and then running your own final 4). It’s up to you whether you use the lowest-energy bracket or the most common bracket, but you should justify your result.
- Send me the results! You can then go ahead and enter up to 10 brackets in our bracket pool. If you need to, you can have me enter them for you (this is most likely to happen if you don’t finish this until near the end of/after spring break). The winner will get something great (likely a home-baked treat!).
Here is the code in module form on GitHub:
https://github.com/Daniel-B-Smith/MarchMadnessMonteCarlo
I did a few mini-optimizations, but the thing that is killing you in simulate() is using deepcopy() on your bracket object at every step. Refactoring so that you can call a shallow copy should speed things up considerably.
Thanks, Daniel! I've forked this as https://github.com/mglerner/MarchMadnessMonteCarlo ... which is fairly fun, since I haven't used github before.
Seems the last line for instructions on how to execute
runbracket2should readrunbracket2(ntrials1=10000,ntrials2=1000,T=1.0)?Yes, it should! Fixed above.
I'm in the middle of refactoring things to make it a bit nicer to use. I'll post an update and link it when I'm done. Please pass on any suggestions!
You can see some current code at the below link. I'm likely to post a bigger update tomorrow, but no guarantees.
http://nbviewer.ipython.org/github/mglerner/MarchMadnessMonteCarlo/blob/master/MMMC2015.ipynb
I like the examples added as an IPython notebook.
Thanks. The notebook has been updated, and is the content of my just-updated blog. Summary tables! Example energy functions! Make sure Kansas wins! Whee!
Choosing the most common bracket optimizes your probability of picking a perfect bracket (which Warren Buffet would have given you $1B for last year - so that ain't nothing), but it doesn't necessarily optimize the chance of winning your office/class pool.
One strategy is to find the bracket that has the highest expected score (many pools give more points for correctly predicting later rounds, as well as spoiler points for picking upsets) over the ensemble of brackets you've generated. Luckily, since the probability of making it to any round is conditionally independent of the opponent that you face there, it's sufficient to summarize the probability of making it to any round (which is exactly the table that fivethirtyeight.com publishes) to calculate an expected score. All that remains is to pick a bracket to optimize your expected score. Since you've already got some MC code written, you're most of the way to writing a simulated annealing optimizer for your pick!
(Spoilers: I already did this... I'll tell you how terrible it is later.)
Jessen, that's awesome. My update for this year (http://nbviewer.ipython.org/github/mglerner/MarchMadnessMonteCarlo/blob/master/MMMC2015.ipynb is the same as http://www.mglerner.com/blog/?p=49) does make the same table as fivethirtheight.com.
Good call about expected score.
Also good call about simulated annealing. Have you done any looking into what bracket space actually looks like geometrically?
Do let me know how your bracket turns out!
Optimizing for expected score is a strategy that will give you the highest score on average, but it won't give you the best odds of winning your pool. To win your pool, you need to play your opponents not the bracket. In a non-tiny pool, you basically have to pick the national champion correctly to win the pool. If you make the most popular pick, your odds of winning are still fairly low since a bunch of other people made the same pick. When picking your champion, you need to consider both the probability that that team wins the championship and the expected number of people in your pool picking that team.
Slate publishes a story about this every year:
http://www.slate.com/articles/sports/sports_nut/2015/03/ncaa_bracket_picks_2015_why_you_should_bet_against_kentucky_and_pick_arizona.html
Yup, you're right that optimizing expected score is not the optimal strategy, but I'd guess that for your typical office pool, it is a probably approximately correct (a real term, though I'm abusing it here) strategy. The strategies that the Slate article goes into don't start applying until the pool gets large enough (roughly when the probability that one of the other N-1 entrants picks a "lucky" mainstream bracket grows larger than the probability that a black swan bracket wins).
Out of expediency I went with expected score calculations, but here's a potentially better strategy:
1) Generate an ensemble of potential outcomes
2) Generate an ensemble of potential competitive brackets (good source data here: https://tournament.fantasysports.yahoo.com/t1/pickdistribution)
3) Estimate your bracket's probability of winning using those two ensembles (this will depend on the size of the pool)
4) Optimize!
For small N, I think this looks more like score maximization. For large N, I believe this is approximately equivalent to the "hedge fund" strategy of picking the black swans. I don't know at what N the crossover happens, but I'd guess it's closer to 100 than to 20. One other thought: I think you can get an additional edge from the observation that people's picks from round to round are not independent (witness mglerner's unhealthy obsession with Kansas 🙂 ). Not sure how to model that, but I'd guess I'm getting into third- or fourth- order effects at this point.
Now, to empirical results:
I've entered my expected-points-maximizing bracket into two pools with different scoring schemes (one a standard scoring scheme with upset points, and the other is too convoluted and byzantine to explain here). Kentucky was picked to win in 5 out of 14 and 7 out of 18 of the brackets, respectively (including both of my brackets), so I feel like I'm still in the realm where maximizing points matters more than worrying about monkeys at typewriters. I'm sitting at 3rd place in both pools, though within spitting distance of 1st in both. Unfortunately, my two brackets have Villanova and Virginia in the finals, so things are not looking so bright.
However, I'm still doing better than last year, where my strategy was more akin to "do I know someone who went there?"
I think Kentucky this year is a great example of where the points maximizing strategy breaks down even for small pools. From the small pools I've seen, >50% of brackets pick Kentucky to win in spite of them having an estimated ~35% chance of winning. Even in a small pool, you are much more likely to win having picked a team like Arizona because your odds of winning picking Kentucky even conditional on Kentucky winning are pretty low.
It's funny that this is a bit different from poker, where many people vastly overestimate the need for exploitative play.
Yeah, I think you're right. Basically, I'm counting on the triage opportunities in the earlier rounds to push my brackets over the top of the others. If there isn't enough inefficiency in other people's picks, it's better to bet on the undervalued champion. Wish I had time to do a more thorough analysis.